Map notes
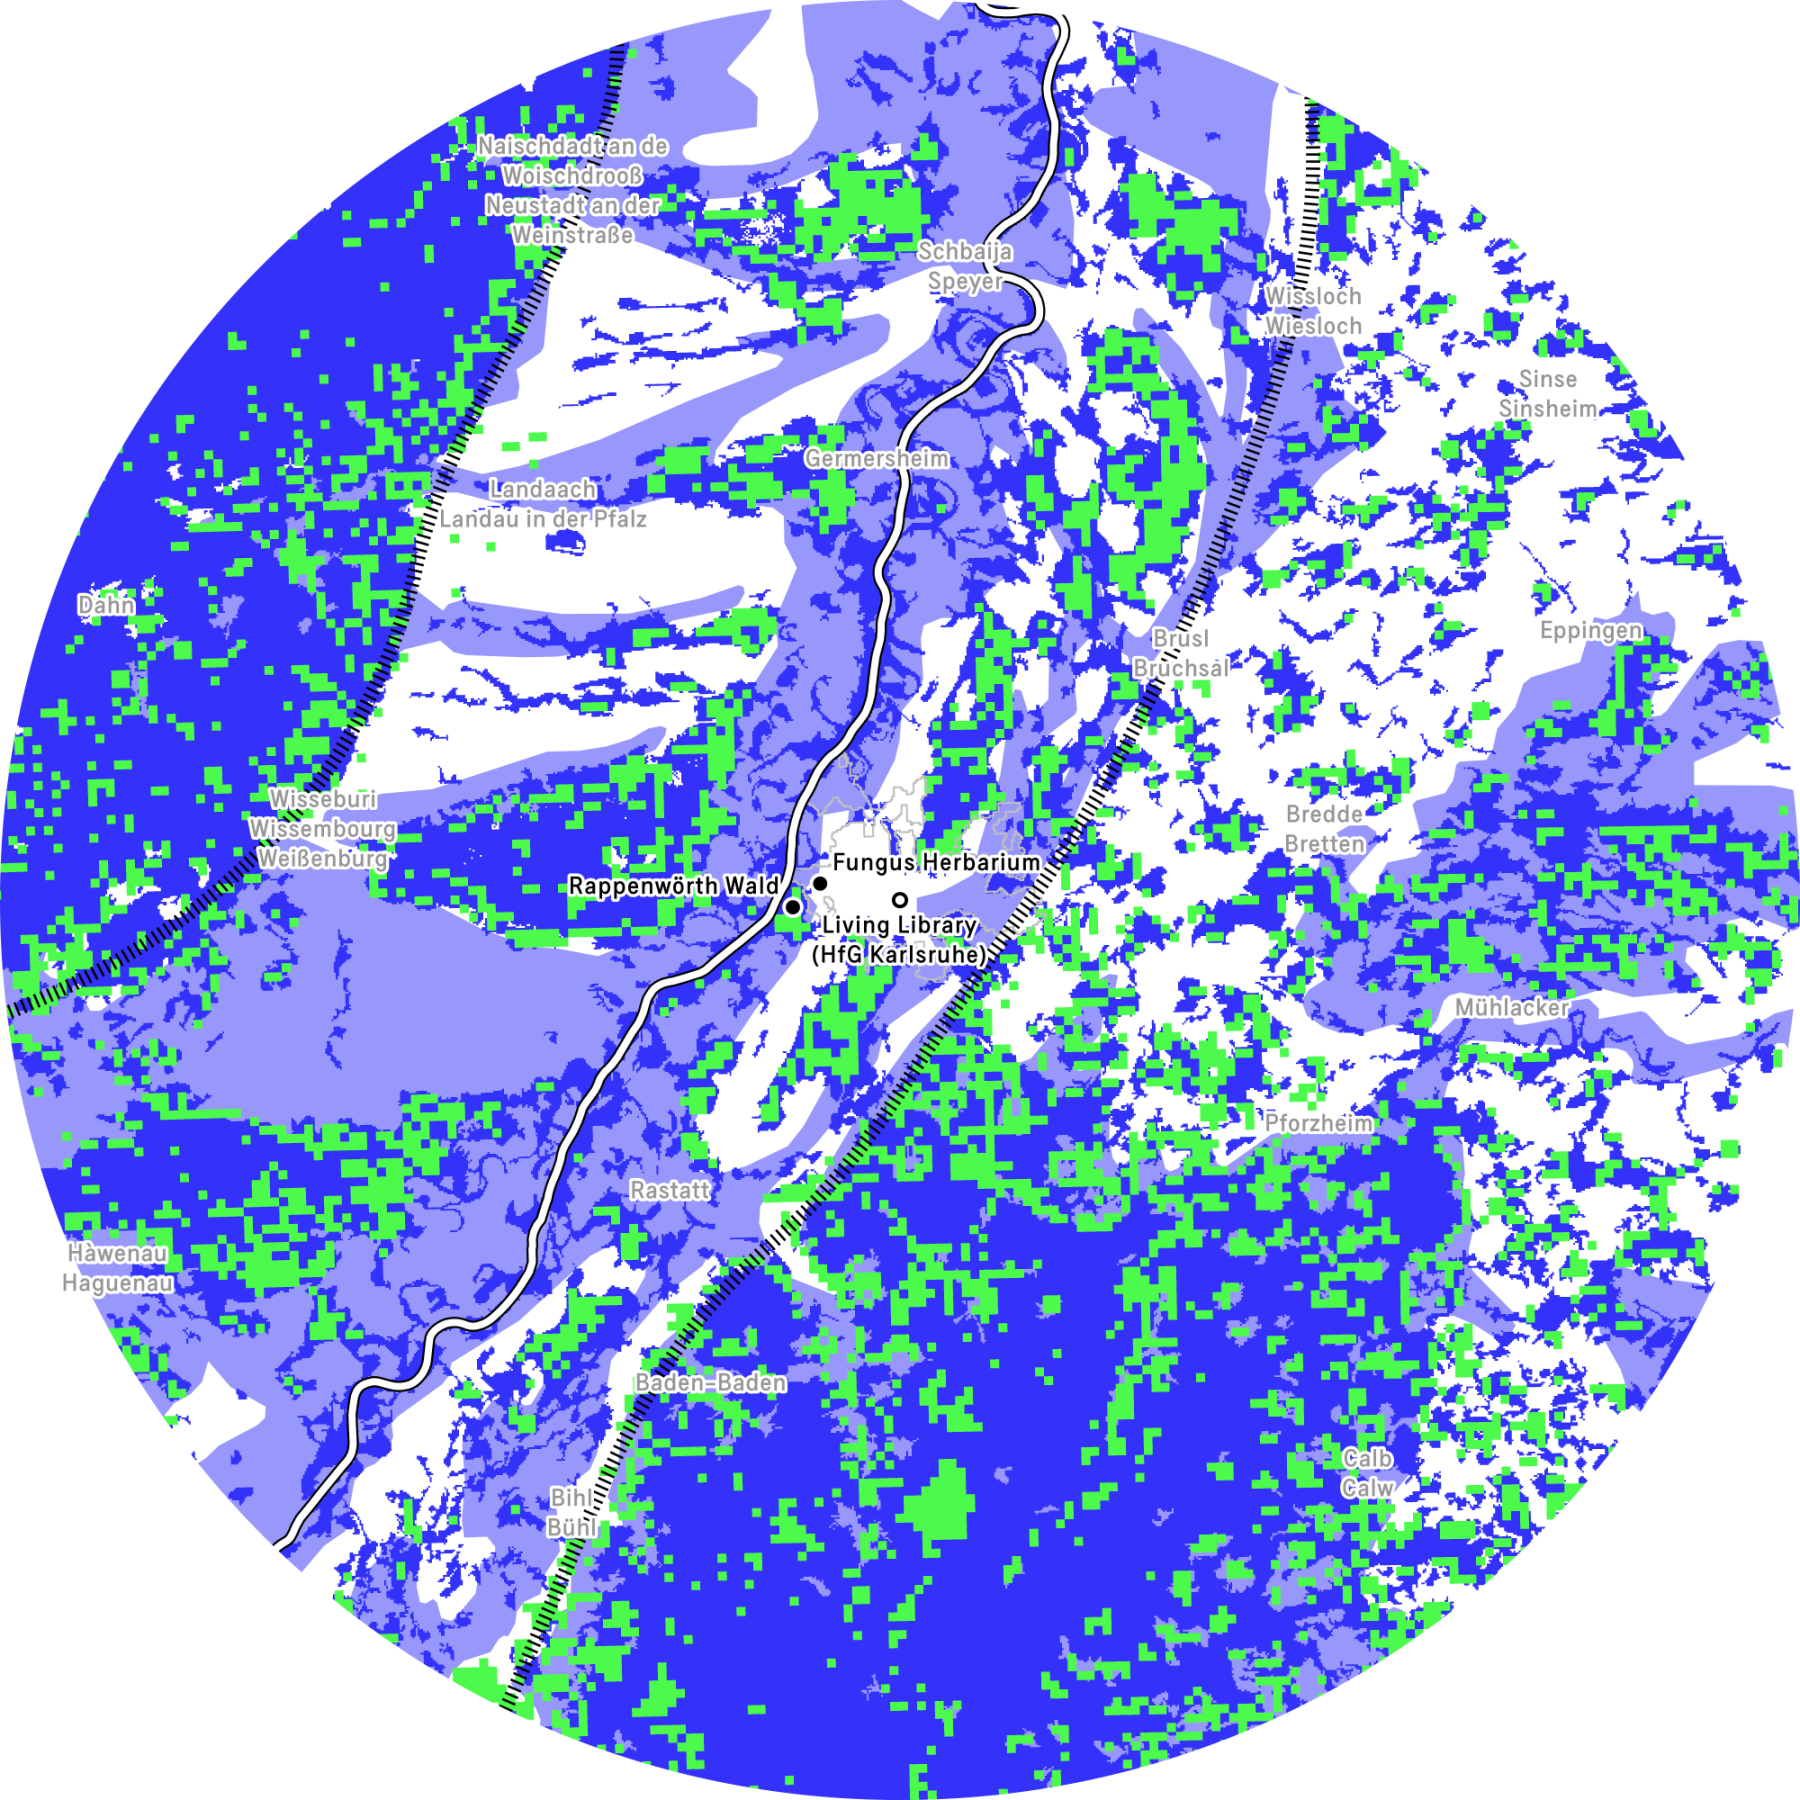
During the ‘On remediation and interfacing’ education programme, students visited the Fungus Herbarium of the State Museum of Natural History Karlsruhe and searched for mushrooms in the Rappenwörth forest. Although it is impossible to map the exact locations of mushroom growth, it is possible to identify areas with a high likelihood of occurrence. This map combines three such indicators: observed soil organic carbon levels between 9 and 12, soil acidity (measured in H₂O) between pH 5.5 and 6.5, and high available water capacity in the topsoil. Darker shading indicates more favourable conditions.
Referenzen
- European Commission. Joint Research Centre. 2022. LUCAS 2018 Soil Module: Presentation of Dataset and Results. Publications Office. https://data.europa.eu/doi/10.2760/215013.
- European Commission, Joint Research Centre. 2025. ‘Observed/Typical SOC Index’. European Soil Data Centre (ESDAC). https://esdac.jrc.ec.europa.eu/content/observedtypical-soc-index.
- Feeney, Christopher J., Laura Bentley, Daniele De Rosa, et al. 2024. ‘Benchmarking Soil Organic Carbon (SOC) Concentration Provides More Robust Soil Health Assessment than the SOC/Clay Ratio at European Scale’. Science of The Total Environment 951 (November): 175642. https://doi.org/10.1016/j.scitotenv.2024.175642.
- GBIF.org contributors, NABU, naturgucker, ArtenFinder, et al. 2025. ‘Fungi Records’. The Global Biodiversity Information Facility, July 3. Text/tab-separated-values,application/zip. https://doi.org/10.15468/DL.YKZZ5M.
- Orgiazzi, A., C. Ballabio, P. Panagos, A. Jones, and O. Fernández‐Ugalde. 2018. ‘LUCAS Soil, the Largest Expandable Soil Dataset for Europe: A Review’. European Journal of Soil Science 69 (1): 140–53. https://doi.org/10.1111/ejss.12499.