Many of the choices made in the project are cartographic choices. In defining our local bioregion as a circle, the Living Library drew inspiration from early maps of the city of Karlsruhe. The original plan for the city, from 1718, envisioned a perfect circle around the Karlsruhe Castle (Schloss Karlsruhe) with radial streets from the centre outwards (hence its nickname ‘Fächerstadt’ or 'fan city').
There are many approaches to mapping, each containing deep cultural and economic traditions. To show that mapping cannot be defined by a single approach, the education programme of the Living Library explored two distinct ways of mapping: mapping from above and mapping from below. This small guide shares some of those experiences and offers practical steps for applying them yourself.
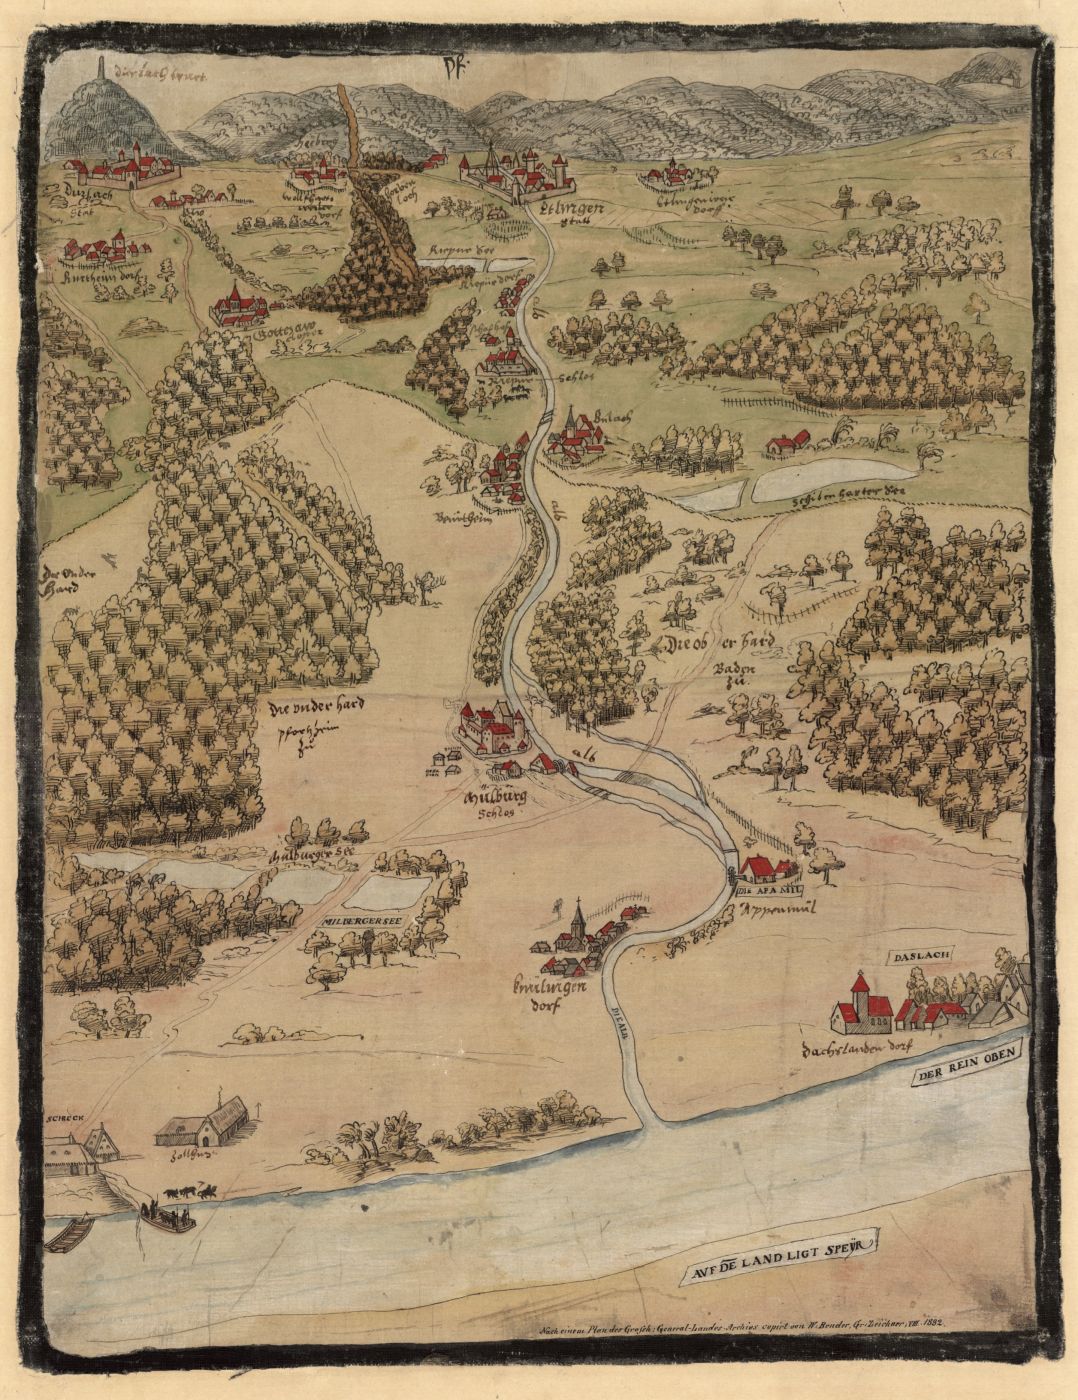
Map of the region around Karlsruhe from the end of the 16th century. Starting from the river Rhine, the map looks east following the river Alb towards the Black Forest.
© Stadtarchiv Karlsruhe 8/PBS XVI 14.
1. Mapping from above
This first approach is the most accessible, as it can be done from anywhere with only a computer and an internet connection. Mapping from above means using publicly available data sources such as satellite images, open-source maps (like OpenStreetMap), or public biodiversity databases (such as GBIF) to learn about the geography, land use, or living systems of a region. This data can then be used to create a wide range of maps showing: forests across a region, mushrooms recorded online, or allotment gardens in Karlsruhe. There are countless online places where geographical data about natural materials is available. Many of these tools and related software are freely available, often requiring only proper attribution of the data sources.
For a practical example of mapping from above, let’s look at Map №6, showing trees in the local region around Karlsruhe. In the background, there are several lines running through the landscape. Two of them - the mountain ranges on both sides of the Upper Rhine plain and the river Rhine itself - were drawn on top of satellite images made by the Copernicus Earth observation satellite (operated by the European Space Agency and freely available). Another line, around the built-up area of Karlsruhe, was taken from the ‘Urban Morphological Zones (2006)’ dataset, published for free by the European Environment Agency (EEA). The most important layer of the map shows the forests themselves, drawn from a European dataset called ‘CORINE Land Cover 2018’. This resource classifies land across Europe into 44 types, including three kinds of forests: 311 (broad-leaved), 312 (coniferous), and 313 (mixed).
Note: The map was assembled in QGIS, a free, open-source mapping program that lets users layer and visualise geographic data. It runs on Windows, macOS, and Linux, and there are many helpful online tutorials for beginners.
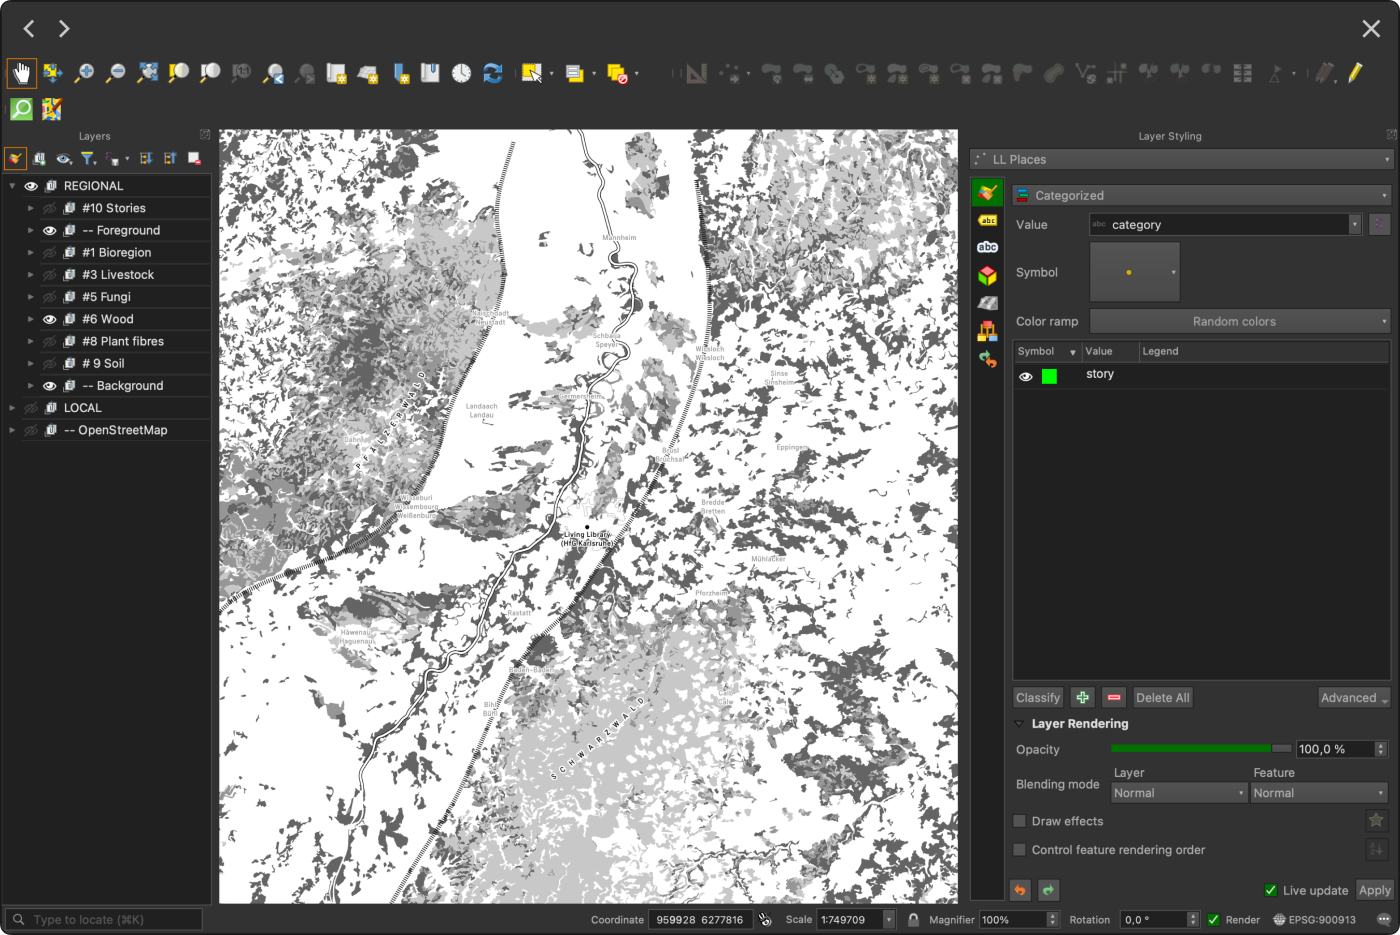
Screenshot of the open-source QGIS app showing several datasets used to create the map of trees in the local region.
2. Mapping from below
This second approach focuses on physically exploring an area: seeing it with one’s own eyes, talking to residents, learning from their experiences, and creating maps that represent a place more freely. Mapping from below requires physical access to the environment. Knowing someone from the area who speaks the local language is highly recommended, as it allows mapping of cultural layers and places that remain invisible to the naked eye. Working with local communities also allows for many different interpretations, views, and experiences of the same place.
For a second practical example, this time of mapping from below, take a look at Map №10: ‘Local knowledge’. It was created during a one-night-only mapping event at the Living Library, part of the Karlsruher Museumsnacht. In return for a free glass of local wine served from a makeshift wine bar called ‘La Carte Locale’ (the area around Karlsruhe is rich in grapevines) visitors were asked to answer a few questions: ‘What natural materials or living things are typical for this region in your imagination?’, and ‘Are your personal memories or experiences connected to a specific season or time of day?’. They then attached their answers, written on postcards, to a large wall map in the physical Living Library.
The result was a huge collection of deeply personal stories and observations. Someone wrote about the apple orchards his father used to take him to when he was a small boy. Another visitor drew pictures of weeping willows, her favourite tree in the nearby forest. They also shared moments when rabbits started living in their allotment garden. Everyone had something to share and many stayed to read the notes by others, discovering material memories they had never considered before. Together, these stories formed a living map, showing how mapping from below can reveal the emotional and cultural connections between an ecosystem and its inhabitants.
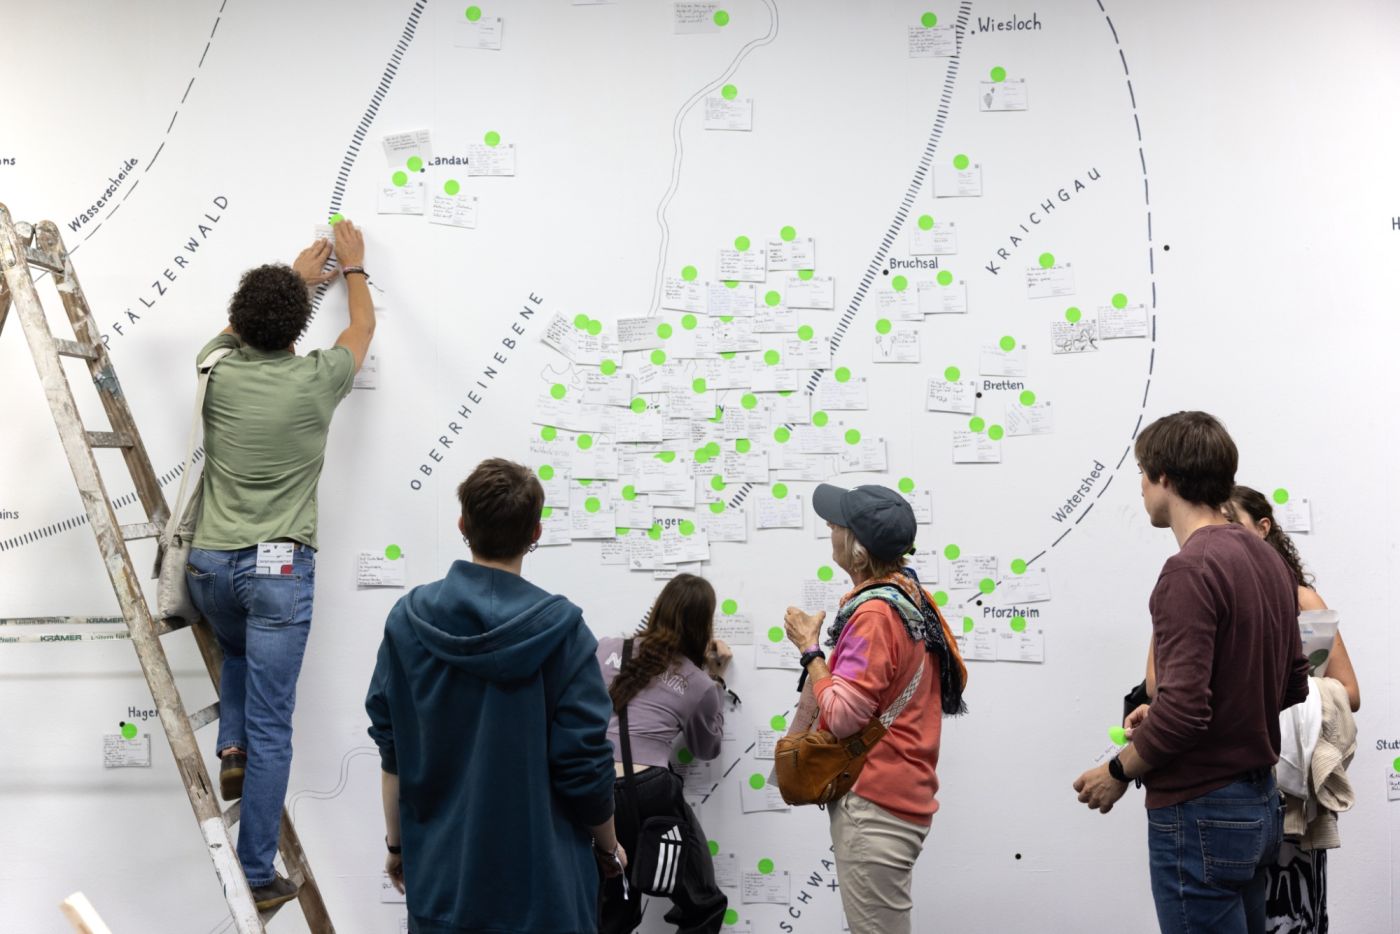
Moments from ‘La Carte Locale’, a one-time only pop-up winebar hosted during the annual Karlsruhe Museum Night to collect local knowledge.
© Bio Design Lab / Living Library
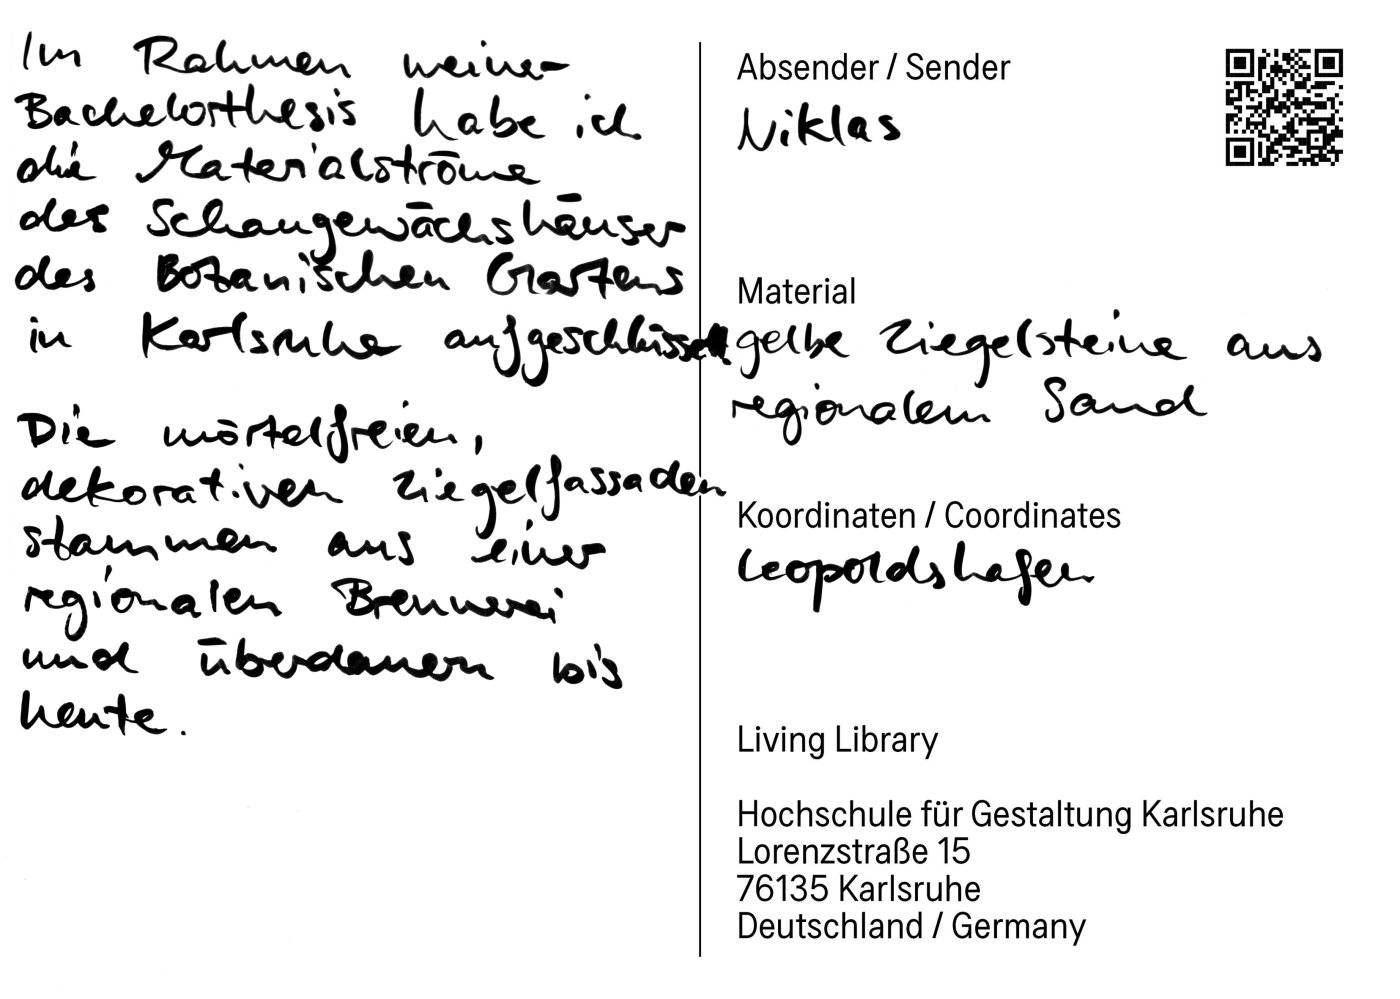
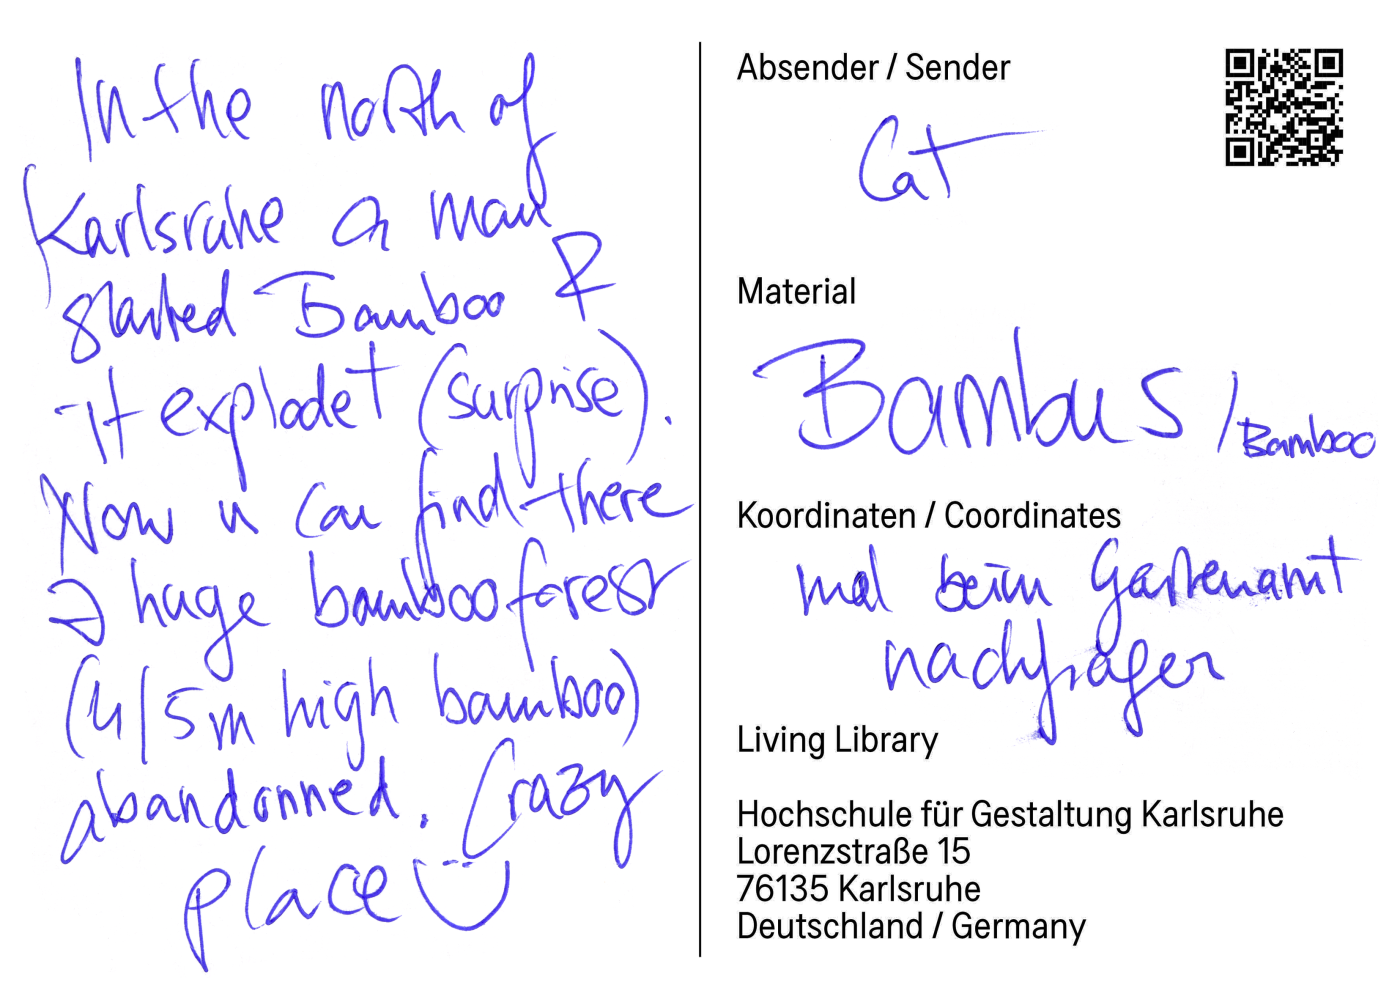
Postcards written by participants of ‘La Carte Locale’ with personal stories about local biomaterials.
© Bio Design Lab / Living Library
Postcards written by participants of ‘La Carte Locale’ with personal stories about local biomaterials.
© Bio Design Lab / Living Library